EMPLOYMENT AND UNEMPLOYMENT FLOWS
25 July 2010
T. S. Coleman PhD
Close Mountain Advisors
www.closemountain.com
Complete .pdf document with detailed figures and tables at SSRN
SUMMARY
Unemployment in the U.S. has risen dramatically since the start of the recession in December 2007, going from about 6.8 million people in May 2007 to over 14.6 million in June 2010. This is often spoken of as "losing 7.8 million jobs," but this is a terribly misleading view of the issue. The reality is that 5 or 6 million jobs were lost each month, with a comparable (just slightly lower) number found each month. Employment and unemployment are dynamic, and to understand them we need to look at the competing forces, the flows in and out, that shape them. By examining the flows we gain a perspective that is not available if we examine only the levels of employment and unemployment.
The major conclusions are:
- Dynamics: Employment and unemployment are hugely dynamic, with large flows in and out even during the current severe recession.
- Employment: Declines during the recession have been largely due to decreased probability of finding a job. There has been very little impact from changes in the probability of losing a job.
- Unemployment: Increases have been, not surprisingly, largely due to lower probability of finding a job and higher probability of losing a job to unemployment.
- NLF: Not in the labor force (NLF) is enormously important. First, the monthly flows in and out of NLF are large. Second, higher propensity to move from NLF to unemployment is a significant contribution to higher unemployment and, surprisingly, contributes to an increase in employment (that partially offsets the overall decline). The changes in probability of moving between unemployment and NLF seem to look like an "anti-discouraged worker" effect - during the recession people are more likely to move from NLF to unemployment and less likely to move from unemployment to NLF.
- Current Recession: The dynamics of employment and unemployment during the current recession do not appear qualitatively different from the recessions of the early 1990s and 2000s - the effects are significantly larger but qualitatively the same.
Particulars
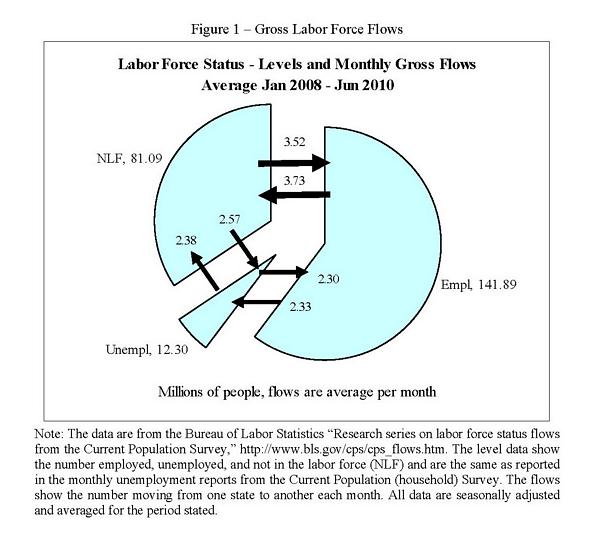
Figure 1 shows basic observations about employment and unemployment from the CPS (Current Population or household Survey). The pie represents the average level of employment, unemployment, and not in the labor force (NLF), number of people in millions for January 2008 through Jun 2010. The arrows represent the average of monthly flows.
The first thing to note is the large size of these flows. Consider unemployment. Figure 1 shows there were roughly 4.9 million people each month entering unemployment and roughly 4.7 million leaving, or almost 40% of the number unemployed. Employment is the same story. Flows in and out of employment according to figure 1 were about 6 million per month - even during the worst US recession in over 75 years. Unfortunately, there were more jobs lost than found each month, but this focuses our attention where it should be - what influences the flows in and out and how those flows determine the levels. Finally, the flows to and from not in the labor force (NLF). The size of the flows argue that the distinction between unemployed and NLF is somewhat artificial (many new employees come directly from NLF). We will see below that the economic significance of changes in NLF flows means we must account for NLF behavior to understand changes in employment and unemployment.
There are reasons to think the data shown in figure 1 over-estimate the monthly flows. The evidence is that the over-estimation might be something like 5-20% for flows between employment and unemployment and 30-50% for flows in and out of NLF. Even allowing for such over-estimation, however, the flows are large, economically significant, and critical to understanding changes in employment and unemployment. Even allowing for over-estimation the flows in and out of unemployment are on the order of 3 million plus each month, and more than 4 million new jobs each month. In the end, whether the exact number of new jobs is 4.5 million or 5.8 million is irrelevant to the larger point - a significant number of people flow between labor force states each month.
As a mental model of unemployment we often use what I might call the "lump of proletariat" model of changing unemployment. Unemployment is like a bucket full of lumps of proletariat. Each month a lump is either added (unemployment goes up) or removed (unemployment goes down). In reality a better mental picture is the bathtub model - unemployment as a tub of water with an open spigot pouring water in and a pump briskly draining water out. The volume goes up by five gallons not because five gallons are added - it goes up because 115 gallons are added but only 110 are removed. The approach to understanding the bathtub is very different than understanding the bucket of proletariat. With the bucket we focus on the lump or the change in unemployment - how and why did 200,000 people come into unemployment this month? With the bathtub we focus on how many new entrants become unemployed compared with how many leave. We recognize that the tub is fuller by 200,000 people because 4.9 million entered but only 4.7 million left. We focus on why only 4.7 million left and where they went - we focus on the rate of entry and exit as the determinants of the level.
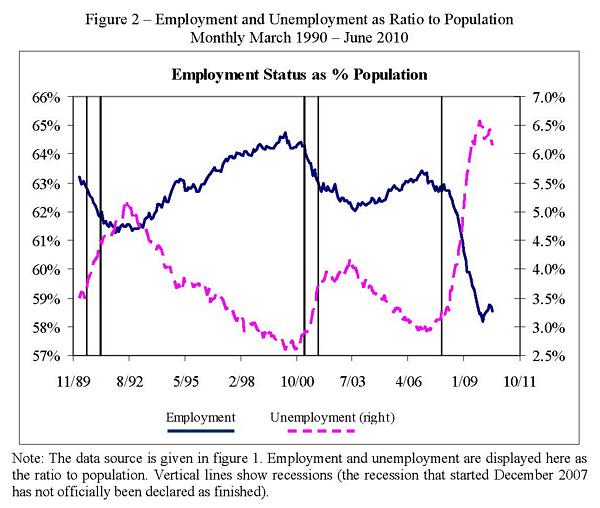
Figure 2 shows the history of employment and unemployment levels since 1990 (measured as a ratio to population to adjust for growth in population). The effect of the late 2000s recession is obvious: unemployment rose about 3.5 percentage points and employment fell about 5.2 percentage points.1
The monthly flows (as in figure 1) are what determine the levels of employment and unemployment. The flow data contain valuable information and insight into what drives the changes in employment and unemployment.2 The flows, however, can also provide a few surprises. For example, the flow u->e (from unemployment to employment) generally rises during a recession. Naively one might think that this means lower job-finding rates do not contribute to lower employment or higher unemployment, but as we will see shortly, the opposite is true.3
In analyzing the flows we need to look at the conditional flows or probabilities rather than the gross flows themselves. The conditional probabilities are the economically relevant variables. The flows are determined by people making individual decisions and we need to normalize by how many people there are making those decisions.4 From figure 1 we see there are six flows:
- u->e: an unemployed person finds a job
- n->e: a person not in the labor force (NLF) finds a job
- e->u: an employed person loses a job and goes to unemployment
- e->n: an employed person loses a job and goes to NLF
- u->n: an unemployed person moves to NLF
- n->u: an NLF person moves to unemployed
To decompose changes in employment and unemployment we analyze the steady-state levels implied by the conditional probabilities. Steady-state levels depend only on the conditional probabilities, so concentrating on the steady-state isolates the effect of changes in conditional probabilities. What makes focusing on steady-state useful is that the steady-state time-series matches the actual levels closely (particularly for unemployment), giving confidence that conclusions we draw from analysis of the steady-state apply to changes in observed levels.
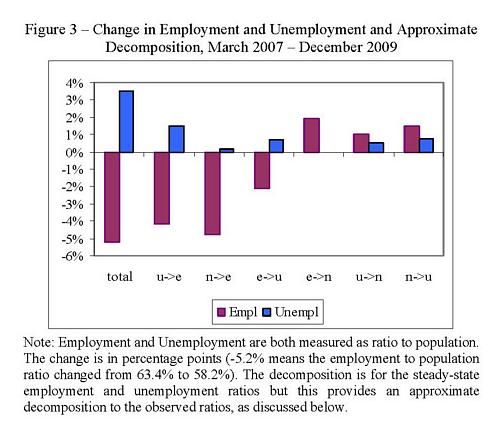
Figure 3 shows the decomposition of changes in employment and unemployment for the recent recession due to changes in the conditional probabilities. The decomposition is only approximate (discussed more in the next section and the appendix) but it does provide a useful view into what drives the changes in employment and unemployment. The figure shows the total change in unemployment and employment (+3.5 and -5.2 percentage points) together with an approximate decomposition resulting from changes in the probabilities of moving between states. For example u->e shows the effect resulting from changes in the probability of finding a job conditional on being unemployed (moving u to e).
Employment fell by 5.2 percentage points
- A fall in the probability of finding a job (u->e and n->e) was the biggest contributor. The impact from n->e (probability of finding a job when NLF) was slightly bigger than the impact from u->e
- The probability of losing a job had almost no net impact. The probability of going to unemployment increased but the probability of losing a job to NLF decreased and these two offset.
- Most intriguingly, changes in the probability of moving between unemployment and NLF contributed positively to employment. The probability of moving unemployed to NLF (u->n) decreased and the probability of moving NLF to unemployed (n->u) increased. These increased the level of unemployment relative to NLF; the higher probability of finding a job from unemployment (instead of NLF) increases the level of employment.
Unemployment rose 3.5 percentage points.
- The biggest contributor was the fall in the probability of getting a job if unemployed (u->e)
- The second biggest contributor was the increased probability of losing a job (e->u).
- A fall in the probability of moving unemployed to NLF (u->n) and a rise in the probability of moving NLF to unemployed (n->u) both contributed, as mentioned above.
The changes to and from NLF had important effects:
- The probability u->n went down and n->u went up, and this contributed positively to unemployment.
- The fall in u->n and rise in n->u contributed positively to employment. The effect seems to be that unemployed job seekers work harder to find a job than do NLF job seekers. More unemployed people partially offsets the lowered probability of finding a job.
- I interpret this as something of an "anti-discouraged worker" effect. Prior to the recession an NLF job-seeker might have found a job without searching hard and thus not reported themselves as unemployed. With the recession such a person is forced to search hard and thus are reported as unemployed.
This pattern of changes in flows during the 2007-2009 recession, and their impact on levels of employment and unemployment, matches well with that of the recessions of 1990-1992 and 2000-2003. All three periods exhibited the same pattern of changes in probabilities and the effect of these changes on employment and unemployment levels. What distinguishes the 2007-2010 recession is the magnitude of the changes, not their pattern. (Furthermore, adjusting the flows for possible over-estimation does not change these conclusions substantively.)
DISCUSSION AND DETAILED RESULTS at SSRN
Complete .pdf document with detailed figures and tables
- This is for the period March 2007 to December 2009. This corresponds roughly to the trough-to-peak for unemployment, and starts somewhat before the official start of the recession in December 2010. Unemployment rose from 2.9% to 6.4% and employment fell from 63.4% to 58.2%.
- As mentioned above the flows are probably over-estimated. I continue to focus on the unadjusted flows because there is no ideal or generally-accepted method for adjusting the flows. In the detailed discussion below I do apply one method of adjustment, and find that the results do not change significantly.
- The flow u->e goes up because the conditional probability u->e goes down but the level of unemployment goes up so much that the flow u->e actually rises.
- The conditional probability of moving from one state to another is the actual flow (number of people) divided by the number of people starting in the original state - for example the number moving from employed to NLF (e->n) divided by the number starting in employment.